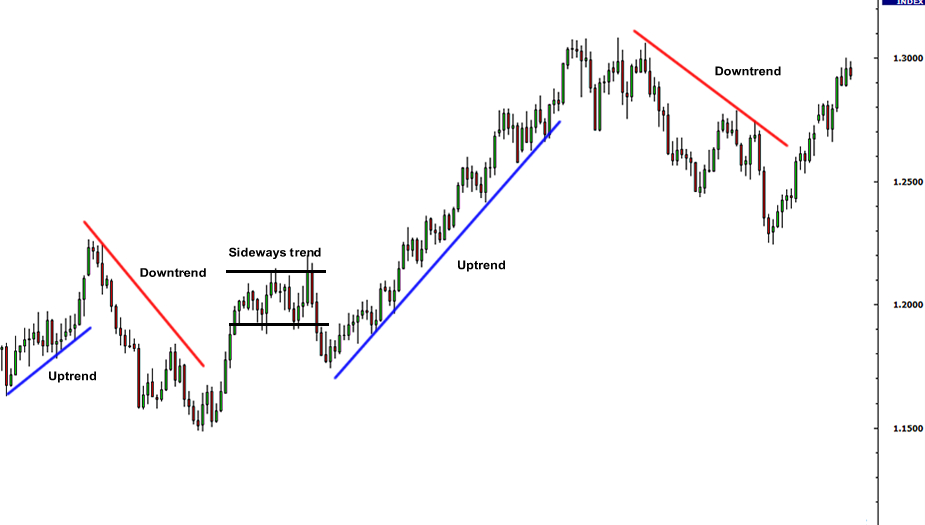
To gain an edge in forex markets, many traders utilize forex charting software packages in conjunction with other technologies such as predictive forecasting software and online trading to estimate the expected direction of a specific currency pair.
TAKEAWAYS IMPORTANT
- A forex chart is a graphical representation of a currency pair’s or pairs’ relative price performance.
- Day traders and technical analysts use such charts to hunt for signals and patterns to help them make trading decisions.
- Line, bar, and candlestick charts are the most frequent types of forex charts, and the most typical time frames provided by most platform’s charting software range from tick data to yearly data.
- Forex charting software is a collection of digital tools designed to make technical trading and analysis more efficient and simplified.
- Forex Charts: An Introduction
A forex chart effectively allows a trader to look back in time, which technical experts believe can anticipate future price movement. For clients who have open and funded trading accounts, most forex brokers will give free forex charting software. Forex charts, like those for other securities, display data that can be used to perform technical analysis on a particular forex (FX) pair.
Forex charts are vital tools for forex traders who want to use technical analysis to decide where to spend their money since they can disclose whether or not there are any trends. Technical analysis is the study of historical market prices and technical indicators in order to forecast an investment’s future movements. Short-term price swings, according to these professionals, are the outcome of supply and demand dynamics in the market for a particular security. As a result, for technicians, the asset’s fundamentals are less important than the current buyer-seller balance.
Line, bar, and candlestick charts can be used in forex charts, and the standard time periods provided by most platform’s charting software range from tick data to yearly data. On the x-axis of a standard forex chart is the time period, and on the y-axis is the exchange rate.
TIPS: Currency charting software is a sophisticated tool that allows users to personalize it and trade directly in the electronic forex markets.
Technical Indicators and Forex Charting
Technical indicators such as price, volume, and open interest will be adjustable on forex charts. These indicators are often used by active traders because they are designed to monitor short-term price fluctuations.
Technical indicators are divided into two categories:
-
Overlays: As the name implies, these indicators do exactly what they say. They can plot over the top of the prices on a stock chart, using the same scale as the prices. Moving averages and Bollinger Bands® are two examples.
-
Technical indicators that oscillate (or vary) between a local minimum and maximum and plot (or display) above or below a price chart are known as oscillators. The moving average convergence divergence (MACD) or the relative strength index are two examples (RSI).
Most charting software will offer a variety of technical indicators to choose from. As a result, a trader must choose from thousands of alternatives to find the ones that work best for them. In most situations, these indicators can also be used as part of an automated trading strategy.
A broker may also provide forex charting software through the usage of a demo or trial account. Before determining where to register an account, it is recommended that new traders try out a few different brokers and charting platforms.
Facts: While there are a variety of forex chart patterns to choose from, there are two typical chart patterns that appear on a regular basis and provide a reasonably simple way for trading currencies. The head and shoulders and the triangle are the two patterns.
The Dow Theory and Forex Charting
Technical analysis of assets has been used by traders and investors for as long as markets have existed, but none more so than Charles Dow, the American journalist and founder of the Dow Jones Company, the Dow Jones Industrial Average (DJIA), and The Wall Street Journal.
The Wall Street Journal published hundreds of editorials by Dow, many of which supported his beliefs on technical analysis of equities market movements. Many forex traders today trade the foreign exchange market using his theories (FX).
The Dow hypothesis, as established by his successors at The Wall Street Journal, is made up of six tenets that imply that asset prices change in response to patterns that emerge from the spread of new information. The Dow theory places a premium on studying transaction volume when it comes to understanding a market’s underlying dynamics, and forex traders who follow its guidance would normally ignore fluctuations in exchange rates caused by a low amount of deals.
Frequently Asked Questions about Forex Charts
What Is a Forex Chart and How Does It Work?
A forex chart is a graph that displays price and volume data for one or more currency pairs over time. A forex chart, for example, graphically illustrates a currency’s historical behavior over several time frames, as well as technical patterns, indicators, and overlays.
What Is the Best Way to Locate Forex Charts?
Financial portals, online brokerage platforms, and sites specializing in currency information are all good places to look for forex charts.
What Is the Best Way to Make a Forex Chart?
Using your broker’s online toolset, you may create interactive charts with technical overlays and tools. Additional advanced traders who require more capability can employ forex-specific platforms and charting software.
What Is a Currency Chart and How Does It Work?
The word “currency chart” simply refers to a forex chart.


