A bullish reversal is indicated by the double pattern, which is a traditional chart pattern. It arises near the bottom of a downtrend and alters market structure to the upside.
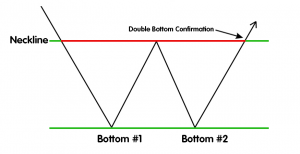
This chart pattern is defined by two almost equal-length lows that resemble the letter “W” in the English alphabet.
What is the meaning of a double bottom pattern?
There will come a point when the bears (sellers) begin to wane after a long downturn. When this happens, the double bottom pattern may emerge to end the bearish pressure completely.
When the price struggles to break through a “support” level, this pattern emerges. This level of support has been tested twice by the price.
If this level is maintained, a double bottom formation will occur. During this time, the price reached a new high, which is known as a neckline.
The figure below provides a thorough illustration to help with this.

A double bottom is made up of two lows and a single neckline. The most crucial component of the double bottom is the neckline.
Note that when the second number is higher than the first, this chart pattern is more accurate.
What Is The Significance Of The Double Bottom?
When lower highs and lower lows are formed, a financial market is in a downtrend. Sellers eventually begin to deteriorate.
In some cases, a level known as support is what puts the price to a halt. A relevant price level that reverses the direction of a currency pair going to the upward is referred to as support.
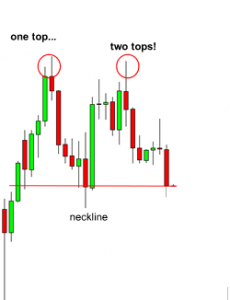
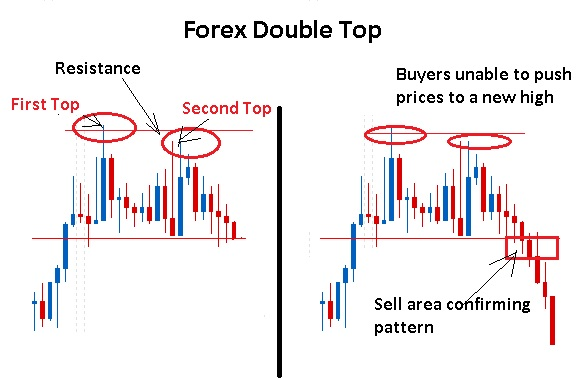
A double bottom pattern is formed when the price strikes resistance twice, generating relative equal lows.
The absence of a new lower low demonstrates the market’s indecisiveness. Following that, a big upward push past the neckline reverses the trend.
Sellers are carefully packing their belongings, as evidenced by the double bottom pattern. Bullish momentum gradually increased, and greater prices were achieved.
It’s vital to remember that these patterns are more valuable when they arise at the end of downtrends.
What Is The Double Bottom Pattern And How Do I Trade It?
At the end of a downtrading market, double bottoms emerge, shifting the market structure to the upside.
The neckline of this chart pattern must be drawn in order to trade it. A retrace occurs when the first low of the double bottom is reached.
This creates a high between the two lows (bottoms), and the neckline is defined as a vertical line drawn on top of this high.

Orders can be placed once the neckline has been drawn and broken. More cautious traders, on the other hand, will hold off on placing a buy order until the neckline has been retested.
Placement of the Stop-Loss
The stop-loss is the most crucial variable in any trading system; capital must always be protected.
Your stop loss should be put below the second low in the case of a double bottom pattern.
I positioned the stop loss slightly below the second low, as shown in the chart above.
Goal for Profit
Between the second low and the neckline, the pip-count is determined to determine your take profit.
Because the price frequently flies past this target, a trailing stop can be set if it is reached or partials are taken.
Is It Bearish To Look For A Double Bottom Pattern?
The double bottom is not a bearish pattern, unlike the double top.
A bullish reversal pattern, on the other hand, is a double bottom. At the end of a downturn, this chart pattern develops, moving market structure to the upside.
“What is a double bottom pattern and how do you trade it?”
Find two similar lows on a forex chart. Before placing an order, double-check that a candlestick has closed above the neckline. Below the second low, a stop-loss must be set.
“Is the double bottom really accurate?”
When certain restrictions are followed, the double bottom pattern is highly precise. The first is to verify that the second low is equal to or greater than the first.
In addition, a split in the neckline verifies the double bottom design, so it must be anticipated.
Pattern with two bottoms in summary
The double bottom pattern is an extremely simple chart pattern to recognize. They should only be traded near the end of a decline, however.
In addition, proper trading of this pattern must be ensured. Being reactive rather than anticipatory is a hallmark of a smart forex trader.
With this in mind, it’s crucial to hold off on making a trade until the price breaks through the neckline.


