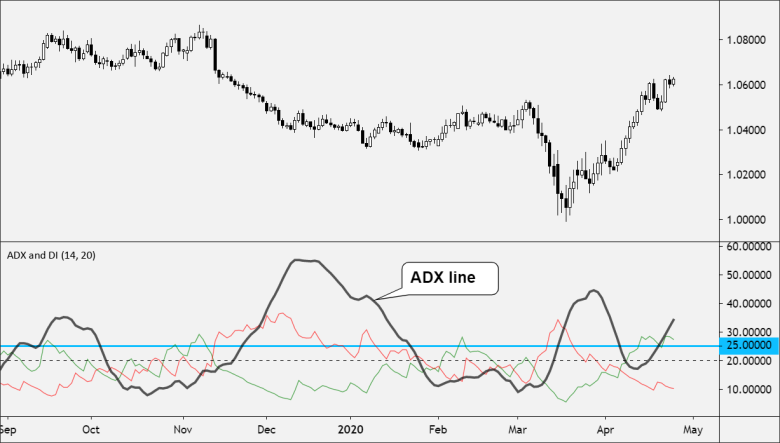
The Average Directional Index (ADX) is a technical indicator that is used to measure the strength of a trend in the financial markets. Developed by J. Welles Wilder, Jr. in the late 1970s, the ADX is part of a group of technical analysis indicators known as “oscillators.” It is calculated by taking the difference between the high and low price of an asset over a given period of time, and then smoothing out the results with an exponential moving average.

The ADX ranges from 0 to 100, with readings above 25 generally indicating that a trend is strong and readings below 20 indicating that a trend is weak or non-existent. When the ADX is rising, it indicates that the trend is gaining strength, while a falling ADX indicates that the trend is losing momentum. The ADX is often used in conjunction with other technical analysis indicators, such as moving averages and the Relative Strength Index (RSI), to provide a more complete picture of the market’s trend and momentum.
How to Use ADX
The ADX can be used in several ways to help traders identify the strength of a trend and potential trading opportunities. Here are some common methods:
- Trend strength identification: When the ADX is above 25, it indicates that the trend is strong, and traders may consider entering a trade in the direction of the trend. Conversely, when the ADX is below 20, it suggests that the trend is weak, and traders may want to avoid entering new positions until the trend gains strength.
- Momentum analysis: Traders can also use the ADX to analyze momentum. If the ADX is rising, it indicates that the trend is gaining momentum, and traders may want to consider entering a trade in the direction of the trend. If the ADX is falling, it suggests that the trend is losing momentum, and traders may want to consider exiting any existing trades or waiting for a stronger trend to develop.
- Divergence analysis: Traders can also look for divergences between the ADX and the price of the asset being analyzed. For example, if the price is making higher highs while the ADX is making lower highs, it may indicate that the trend is losing momentum, and traders may want to consider exiting any existing long positions.
It’s important to note that the ADX is a lagging indicator, meaning that it’s based on past price movements. As with any technical analysis tool, it’s not foolproof, and traders should always use other indicators and fundamental analysis to confirm any potential trading opportunities.
How to Calculate ADX
The ADX is calculated using two directional indicators, DI+ and DI-:
- The positive directional indicator (+DI)
- The negative directional indicator (-DI)
The Directional Movement Index (DMI) is used to calculate these two indicators.
The difference between DI+ and DI-, as well as the sum of DI+ and DI-, are used to calculate ADX.
The difference is subtracted from the sum, and the result is multiplied by 100.
The resulting value is known as the Directional Index (DX).
After then, a moving average of DX is calculated, often over a fourteen-day period (but any number of periods might be utilized).
This final moving average is the ADX.


