The RSI, or Relative Strength Index, is a technical indicator that compares a currency pair’s up and down movements over a specific time period to determine its strength or weakness.
This is accomplished by tracking recent price increases and losses and comparing them to the present price.
The RSI is a momentum indicator, which means it’s used to figure out how fast and how strong price movement is, as well as if the underlying momentum is rising or waning.
RSI is utilized to identify overbought and oversold positions, as well as divergence and concealed divergence indications, in addition to assisting traders identify market momentum.
The RSI oscillates between 0 and 100 and is shown as an oscillator (a line graph that bounces between two extremes).

The RSI indicator is represented as a single line on a price chart, and it is derived by combining the following data over a particular period:
- The average gain throughout the course of a certain time period.
- The average loss throughout a certain time period of decreases.
To generate a measure that travels between 0 and 100, a ratio of these two numbers is employed.
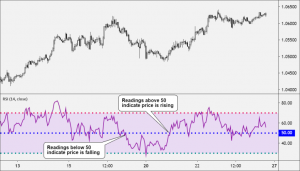
- Price movement that is typically rising is indicated by readings over 50,
- while price movement that is generally dropping is indicated by readings below 50.

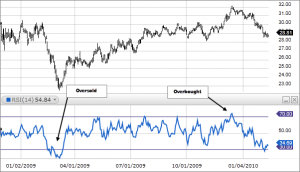
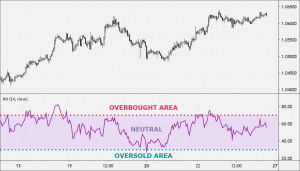
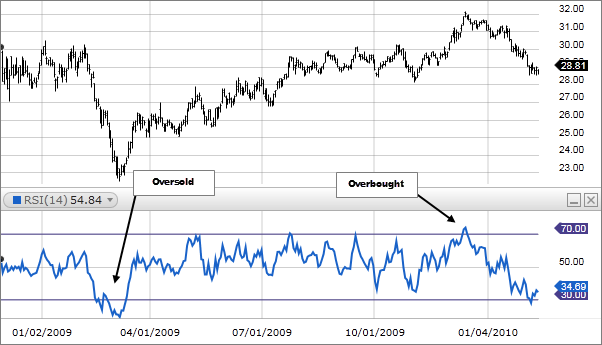
When the RSI falls below 30, it is called “oversold,” and when it rises above 70, it is considered “overbought.” There are three key “areas” to consider:
- 0-30: Area that is oversold (OS).
- 30-70: Area of neutrality
- 70-100: Area that has been overbought (OB).

The Relative Strength Index (RSI) has a default duration of 14 periods.
Traders employ a variety of values, ranging from 2 periods (for weekly charts) to 25 periods (for monthly charts) (for shorter-term timeframes).
How to Trade the Relative Strength Index (RSI)
The Relative Strength Index (RSI) is a tool that may be used in a number of situations. It can be used in the following ways:
- To confirm the emergence of a new trend.
- To indicate whether a recent price movement has “overbought” or “oversold” levels.
- Due to a divergence between the actual price and the RSI indicator, a probable price reversal is signaled.
Let’s look at the many methods for utilizing RSI to produce trade signals.
Oversold/Overbought (Trend Reversal)
As the price declines, the RSI will decrease until it reaches zero. As the price climbs, the RSI will rise towards 100. The more extreme the values, the more the currency pair is regarded “overbought” or “oversold.”
- Overbought circumstances are indicated by a range over 70.
- Oversold situations are indicated by a lower range below 30.
An overbought indication indicates that the current price increase may be coming to a stop (for the time being) and that the price may be heading lower.
An oversold signal indicates that the current price decrease may be coming to an end (for now) and that the price may shortly return.
Convergence/Divergence (Strength/Weakness of the Trend)
- Convergence: When the RSI follows the price in the SAME direction, it indicates possible trend strength and growing positive momentum.
- Divergence: When the RSI moves in the OPPOSITE direction of the price, it indicates that the trend is weakening and the positive momentum is waning.
When the RSI hits an overbought or oversold level, it’s a warning sign that the current trend is about to lose steam.
The presence of an overbought or oversold level on the RSI does not imply that a trend reversal will occur; rather, it indicates that the chance exists.
BUY INDICES
Signal of oversold condition (Trend Reversal)
When the RSI falls to an oversold level (30 or less) and subsequently climbs over 30, it is considered a buy signal.
Alert for an upward trend (Trend Confirmation)
When the RSI falls below 50 and then climbs over 50, it is considered a buy signal.
Signal of a Bullish Divergence (Trend Reversal)
When the price chart and the RSI indicator produce a bullish divergence, a buy signal is formed. When the RSI makes a higher low while the price makes a lower low, this is known as a bullish divergence.
SELL INSTRUCTIONS
Signal of overbuying (Trend Reversal)
When the RSI gets to an overbought level (70 or above) and then falls below 70, it is a sell signal.
Alert for a downward trend (Trend Confirmation)
When the RSI is previously over 50 and subsequently goes below 50, it is considered a sell signal.
Signal of Bearish Divergence (Trend Reversal)
When the price chart and the RSI indicator create a bearish divergence, a sell signal is generated. When the RSI makes a lower high while the price makes a higher high, this is known as a bearish divergence.
How to Work Out RSI
The RSI is calculated in a multi-step procedure that involves comparing average periodic gains and losses to determine relative strength.
This is accomplished by using the following methods:
A gain is a positive change in the closing prices of periodic periods. To find the average gain, combine all of the periodic gains together and divide by the period (Total Gain / Period).
A loss is a change in periodic closing prices that is negative. To find the average loss, combine all of the periodic losses together and divide by the period (Total Losses / Period).
Relative Strength (RS) is a measure of how strong something is in comparison to something else. The average gain is divided by the average loss to get relative strength (Average Gain / Average Loss).
Let’s look at the RSI calculation with the 14-period default setting:
RSI = (100 – (100 / (1 + RS))
RS stands for “Relative Strength” in the calculation above.
We must now determine the value of the Relative Strength (RS).
RS = (14 EMA on the last 14 up bars) / (14 EMA on the last 14 down bars)
You may use the result of the first calculation once you’ve determined the value of the RS. The current RSI value will be shown.


